
www.industry-asia-pacific.com
16
'21
Written on Modified on
Energy, two choices: Reduce it or Pay for it!
The United Nations developed their 2030 Sustainable Development Goals to enhance everyone’s quality of life; they range from Poverty to Climate action. These things concern us all and make good sense. They make even more sense when they can also help us improve our manufacturing productivity, but how does that manifest itself in reality?.
Among Mitsubishi Electric’s goals is to create a low-carbon society through the use of energy saving products and efforts to reduce CO2 emissions
An interesting but relatively unknown fact about Japan is that it has had to develop a culture of self-sufficiency as it no longer has any natural resources. In numbers it is only 6% self-sufficient in energy. That means other sources of energy have to be imported and that is expensive, so saving energy is embedded into every aspect of daily life. For industry that means Japan is a very difficult country to compete aggressively on the global stage from as nearly all resources from energy to labor are so expensive. So how do Japanese companies manage? In the case of Mitsubishi Electric energy saving and Kaizen (continuous improvement), through its e-F@ctory concept, have become part of its DNA. The successes in energy management have resulted in multiple CDP awards for Climate and Water and are the source of a drive to share its experience and know-how.
3 R’s of Sustainability
Many people might not have heard of the “three R’s of sustainability,” but it is as important as Kaizen. The three R’s are; “Reduce” the use of unnecessary things; “Reuse” items whenever possible; and “Recycle” items when their useful life is over. This is practiced widely in Japan and Japanese manufacturing. And in the case of energy, especially from a corporate or manufacturer’s standpoint, it’s even more important. If you use it (sic. energy), you have two choices: Reduce it or Pay for it! It’s totally unavoidable… like paying taxes!
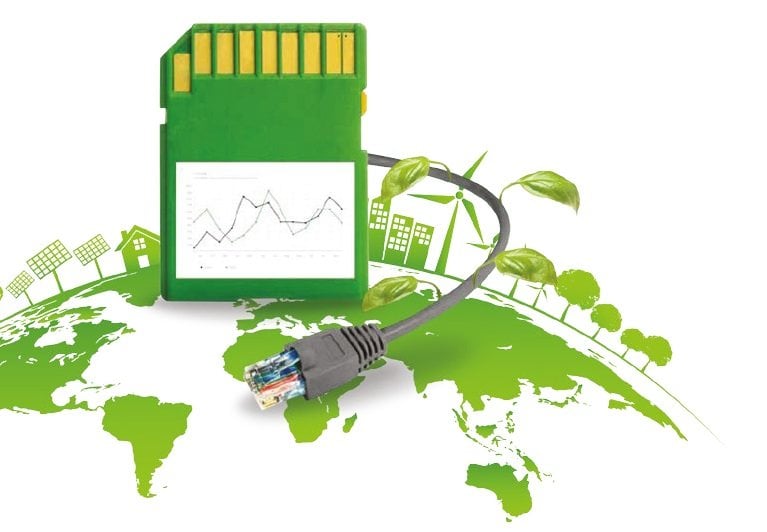
And to make things worse, energy prices have been going up steadily over the past years. In fact, the US Energy Information Administration has demonstrated that the average retail price of electricity has increased 53% for home users and 42% for industrial users over the past 15 years… so it makes sense to treat energy as a precious resource and in some way use it ‘Just In Time’. Therefore, understanding when, where and how much energy is used is the first step to managing its consumption.
What goes up and down at the same time?
An interesting but relatively unknown fact about Japan is that it has had to develop a culture of self-sufficiency as it no longer has any natural resources. In numbers it is only 6% self-sufficient in energy. That means other sources of energy have to be imported and that is expensive, so saving energy is embedded into every aspect of daily life. For industry that means Japan is a very difficult country to compete aggressively on the global stage from as nearly all resources from energy to labor are so expensive. So how do Japanese companies manage? In the case of Mitsubishi Electric energy saving and Kaizen (continuous improvement), through its e-F@ctory concept, have become part of its DNA. The successes in energy management have resulted in multiple CDP awards for Climate and Water and are the source of a drive to share its experience and know-how.
3 R’s of Sustainability
Many people might not have heard of the “three R’s of sustainability,” but it is as important as Kaizen. The three R’s are; “Reduce” the use of unnecessary things; “Reuse” items whenever possible; and “Recycle” items when their useful life is over. This is practiced widely in Japan and Japanese manufacturing. And in the case of energy, especially from a corporate or manufacturer’s standpoint, it’s even more important. If you use it (sic. energy), you have two choices: Reduce it or Pay for it! It’s totally unavoidable… like paying taxes!
And to make things worse, energy prices have been going up steadily over the past years. In fact, the US Energy Information Administration has demonstrated that the average retail price of electricity has increased 53% for home users and 42% for industrial users over the past 15 years… so it makes sense to treat energy as a precious resource and in some way use it ‘Just In Time’. Therefore, understanding when, where and how much energy is used is the first step to managing its consumption.
What goes up and down at the same time?
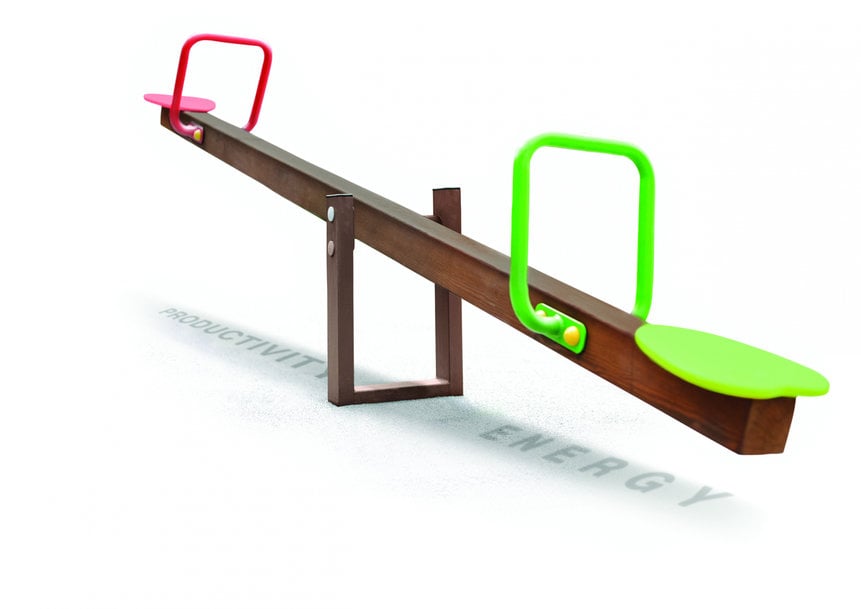
What goes up and down at the same time?
It’s an innocent riddle which actually has a serious lesson behind. The see-saw is an interesting metaphor for the manufacturing context because it hits the bottom line; the actual answer is Energy and Productivity, i.e. as energy consumption increases productivity naturally decreases.
Energy saving could be simply executed by turning off all your machines, but how does that help because you are now unable to produce? Therefore, if you focus on improving productivity, i.e. making more saleable products with less energy you have solved the real puzzle. And that’s why at Mitsubishi Electric energy saving is not about cutting costs but about improving productivity.
Key concept
There is one key concept which is fundamental to changing the perception of energy usage. Mitsubishi Electric calls this EPU; the Energy Per Unit produced. It is simply the amount of energy consumed to produce one product.
EPU has two powerful attributes; it allows the direct association of the energy cost to the manufacturing activity; it is also variable/ dynamic. That does not sound so important until you have a line stoppage and the EPU starts to rapidly increase as energy is consumed but product is no longer being produced. The second attribute is that it makes it easy to compare production performance between lines, or even factories because the EPU is entirely driven by the efficiency of production, i.e. productivity. And this is why Mitsubishi Electric uses it to benchmark themselves but also to drive energy saving activities.
Typically, manufacturers have a very clear idea of the material costs, direct and indirect labor costs, logistics, depreciation, etc. related to their manufacturing processes. But very rarely do they actually know anything other than the headline energy consumption.
By applying the e-F@ctory concept of ‘connect everything’ and measuring what’s important, customers are able to derive the EPU. The great thing is energy monitoring can be applied retrospectively to any existing site or machinery. Modules can be added to existing breakers directly or distributed measurement points can be installed without disrupting the existing production or cabling – simply clamp over the appropriate CT modules.
Connecting these to local meters and monitoring stations makes it easy to pull all that data back to a central management point. The more visibility that is given to that data the more change effect can be created. Here are some real use cases.
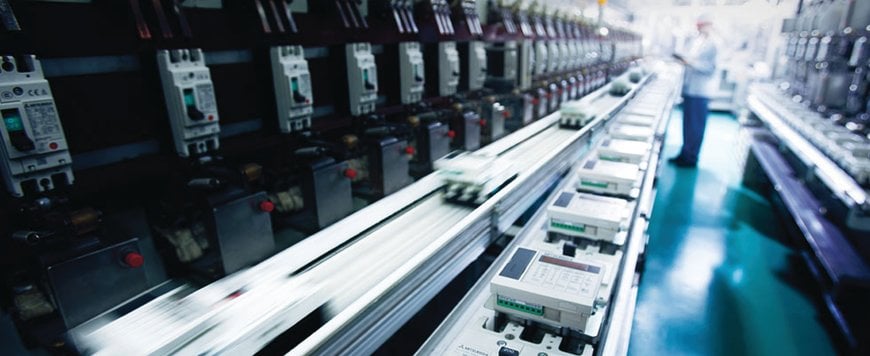
Case #1: The circuit breaker line
As noted, energy costs have been rising in Japan. This was compounded by the consequences of the Fukushima earthquake which meant all nuclear power plants in the region were also shut down, leading to even more expensive energy and in some areas additional usage regulations.
So, what was the countermeasure? In the case of a circuit breaker line, a typically price sensitive product, what did we learn? Firstly, the energy consumption needed to be visualized, that meant energy data needed to be collected from every part of the process. The result was a very clear picture which could be drilled down from production hall, to line, to individual machine. The other key aspect was the time base of the measurement frequency – this was critical to catch the root cause of problems. Looking for correlation between events even on different processes and machines quickly revealed where the real problems were.
The last major learning point was that sadly technology does not solve everything. There has to be a strong commitment as a company, which filters down to every employee working towards the same goal and that’s why sharing the data on a wide basis makes everyone aware of the scale of the problem. Then it’s a case of going through the simple steps; visualize the issue, find the cause, take action – its pure PDCA!
For a low margin product like a breaker, coupled with fierce global competition, every cent saved counts.
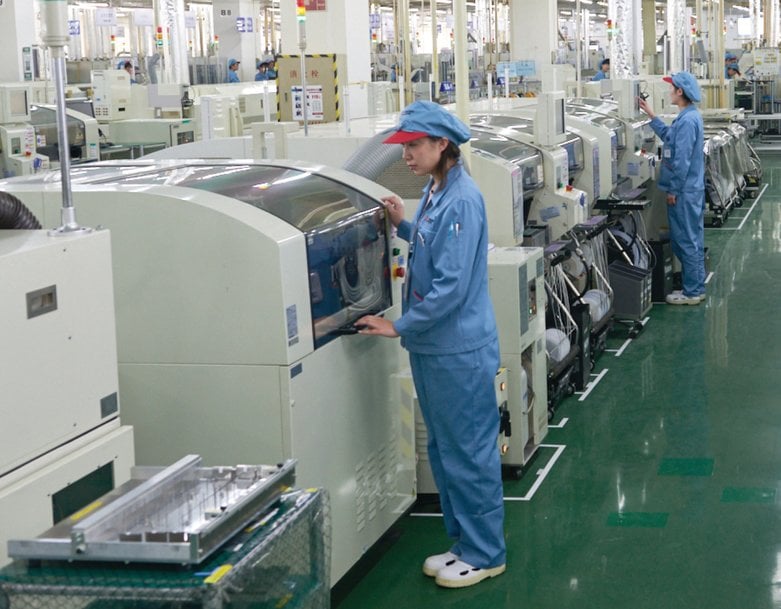
Case #2: The circuit board line
In this example, the direct impact of EPU analysis was clearly the major contributing factor. The challenge for the production staff was that there were multiple machinery and production lines which experienced frequent line stoppages (micro-stops) making it hard to grasp the real energy usage in those lines.
As in Case #1 the first step was to collect the data, but collection was not limited to energy only. Additional information such as the production schedule, equipment data, quality data and process error data were also collected. The critical point was this was collected in ‘real time’. That meant extensive line-side data processing, time-date stamping and filtering, so Edge Computing was an important element to make that possible.
Initially the production staff were flooded with data, graphs and analysis – so much so they could not see what was happening. After applying EPU techniques they could start to pinpoint when production dropped and energy peaked, and cross reference that with error and quality information. This revealed several things;
- They were setting up/starting the machines too early in the morning before the main production commenced.
- They saw frequent stops due to material shortages.
- Equipment trouble and extended downtime occurred because maintenance members all took their break at the same time.
Sometimes the problem is a combination of events or things that happen infrequently, so capturing and analyzing the data are important steps to get right.
The biggest energy consumer was identified as the curing oven. However, it could not easily be regulated as a constant temperature was needed and there was a time lag between taking action and its effect. So, from the EPU analysis the ovens utilization was the single most important issue; the production staff recognized they needed to keep it as busy as possible.
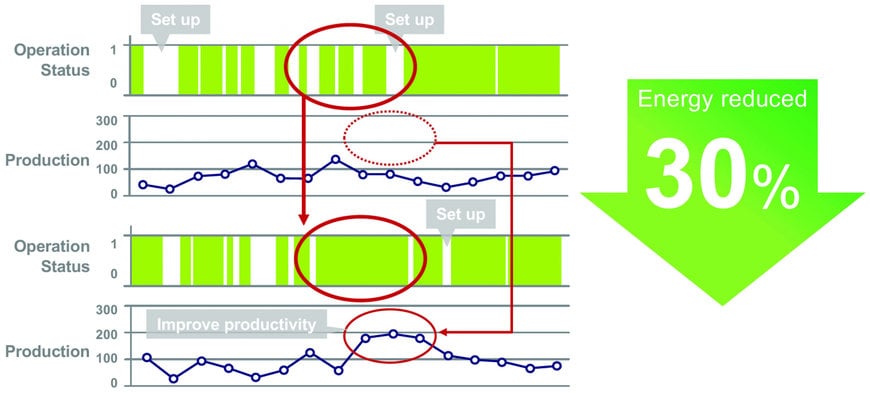
To minimize the non-productive time during the “change over” for different products (when energy was still being consumed but nothing was produced) it was determined that a ‘Change Over’ support system was needed. The target was to reduce the downtime and the number of changes required so it needed to be fundamentally linked with the production planning system. The result was worth it, energy consumption was reduced by 30%.
Small incremental improvements are better than no improvements at all. Every solution does not have to be 100% correct but will move you closer to the goal.
Case #3: Energy based predictive maintenance
The title of this example is quite self-explanatory. When a machine fails it is no longer productive but may still be consuming resources. Therefore, understanding in advance when a machine is likely to fail can be a big help, and energy consumption can be a great indicator of when something is going wrong.
A simple example is when a motor bearing is running dry or is damaged it encounters more friction and hence consumes more energy. So now the energy consumed can be an indicator of the health of the motor. In this case it really was a motor driving a vacuum pump which was failing. This critical part of an electronics production line should have had an expected life of 3-5 years, so no one had expected it to be a potential cause of production problems.
The solution to this problem achieved improved OEE by monitoring the motor’s power consumption and using that as an indicator for predictive maintenance. This was a simple solution without any additional sensors – just using the existing data.
Case #4: Small changes, big results at Mitsubishi Electric Fukuyama Works
In this last example elements from the three previous cases were deployed alongside efforts to change ‘human’ behavior. Before the COVID crisis over 10,000 visitors per year came to Fukuyama Works to hear how it managed to reduce its peak contract demand by around 1,700kW – that’s equivalent to a small solar power station covering 3.4 hectares or approximately 100m JPY (for simplicity let’s call that 1m USD per year…every year). The all-important EPU reduced from 14.3 JPY/ unit to just 5.5JPY/unit – that was a reduction of 62%.
To achieve this in a systematic way it is important to start on small projects where the expected ROI can be checked before scaling the work up for bigger projects. Another important aspect was that a lot of activities were simply to remind people to turn lights off, adjust the air conditioning temperature by 1 or 2 degrees, check for worn motors, identify root causes; perfect examples of the Kaizen approach.
The way forward
Not everyone is an energy expert, so Mitsubishi Electric has packaged up a lot of its know-how into smart components, ready to use templates and solution packs. Additionally, a big effort to share experiences through discussions and regular fact-finding visits are also an important part of Mitsubishi Electric’s approach.
For more insight into energy saving in manufacturing please feel free to watch the noted video:
https://www.youtube.com/watch?v=jXNU3J3xtaY&list=PLz5P-EyPEYH1uKbSRl219l6_ogJp1u82O&index=7